Biodiversity Metrics Meet the Real World: Lessons from a Five-Country Pilot with Nature Helm and New Forests
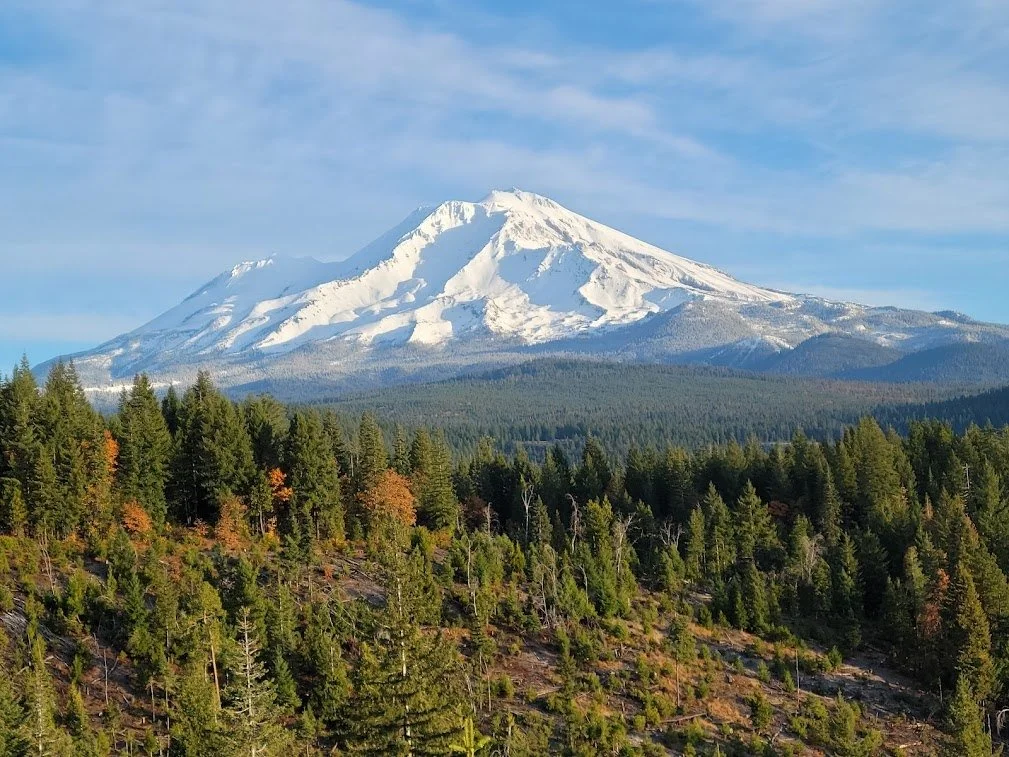
Image Credits: New Forests
Biodiversity measurement has a consistency problem. Organizations managing land assets across multiple geographies are collecting data using different methods, different species checklists, and different monitoring technologies. The result is a body of evidence that is often rich at individual sites but means nothing at portfolio level.
The Nature Positive Initiative, a coalition of 27 global NGOs and leading organizations, has spent years developing a set of State of Nature metrics designed to change that. The ambition is a single credible framework any company can use, regardless of where they operate or what they manage. But ambition and application are different things. Until someone actually runs the metrics across real, messy, diverse landscapes, they stay a framework on paper.
That pilot happened. NatureHelm, a biodiversity intelligence platform founded by conservation ecologist Dr. Debbie Saunders, partnered with New Forests, a global asset manager with over 4.4 million hectares under management across Australia, New Zealand, Southeast Asia, sub-Saharan Africa, and the United States, to run what became the largest NPI pilot anywhere in the world. Five countries. More than 400,000 hectares of assessed assets. Three continents with different operating contexts, different data availability, and different ecological realities. Neither party was certain it would work.
Here is what they found.
The starting problem
New Forests had been doing serious nature-related work since the company was founded in 2005. Acoustic monitoring, game cameras, research projects, partnerships with regional stakeholders. Years of data, inspiring case studies, genuine on-the-ground knowledge. What they didn't have was a common framework for measuring and communicating those outcomes consistently, at the scale of a global portfolio.
The proliferation of frameworks made that harder. TNFD, SBTN, NPI, GRI: which standard to follow? Which metrics to prioritise? When New Forests saw the NPI coming together with 27 founding organisations, it was enough to make the team sit up. The question they brought into the pilot was direct: can these State of Nature metrics give us a credible, consistent view of what's actually changing across our portfolio, using methods that work at scale?
Three continents, three completely different problems
The pilot ran across assets in Australia, the United States, and Africa, and each presented a distinct version of the measurement challenge.
In Australia, the pilot was the largest single NPI pilot undertaken anywhere and completed in partnership with South Coast Natural Resource Management (SCNRM), PF Olsen, and BirdLife Australia. It ran at two scales: one of New Forests' own assets at 56,000 hectares, and the broader landscape of the South Coast of Western Australia covering over 8.6 million hectares. The data environment here was unusually rich. Birdlife Australia had been conducting surveys in the region for a decade. PF Olsen, a regional forestry manager, had detailed records on invasive species management. The SCNRM brought in agricultural producers and indigenous landowners. The challenge was integrating it all into something coherent: satellite-based data, invasive species control records, citizen science observations, and expert field surveys sitting alongside each other for the first time. The Australia pilot showed that a global framework can be applied at a regional scale, provided it connects to local data sources and the people who know the land.
In Northern California, the context was different. A semi-natural mixed-use forest with no clear delineation between plantation and conservation zones. The team had just completed a full year of game camera and acoustic monitoring, so on-the-ground data existed. What was missing was the connection between that data and actual management decisions. The NPI metrics provided that bridge: how can acoustic data inform harvesting plans to maintain species connectivity? How can game camera records be used to prioritise conservation investment? The US pilot showed how the metrics could connect field work to management decisions in a way that investors could understand and act on.
Africa was different again. The pilot covered assets in Uganda, Tanzania, and Mozambique as part of New Forests' African Forestry Impact Platform. These were more recent acquisitions, still in the planning phase, with limited on-the-ground baseline data. What the Africa pilot showed was that this absence of data is not a reason to wait. Using publicly available data across large catchment areas and entire eco-regions, it is possible to identify what species should be present, what monitoring is most needed, and what first steps make sense. Any company can get started because there is enough data in the surrounding landscape to guide initial decisions, even when site-level records are sparse.
The most significant outcome from Africa was a fund-level one. New Forests' African Forestry Impact Platform has a biodiversity impact target: to increase the area of quality habitat protected or restored by 14 percent over the life of the fund. Before this pilot, there was no agreed methodology to track that change consistently. By the end, New Forests and NatureHelm had developed a methodology that the fund's investors formally approved for tracking that target. A global biodiversity framework had been turned into a specific, investor-approved measurement approach for an active fund.
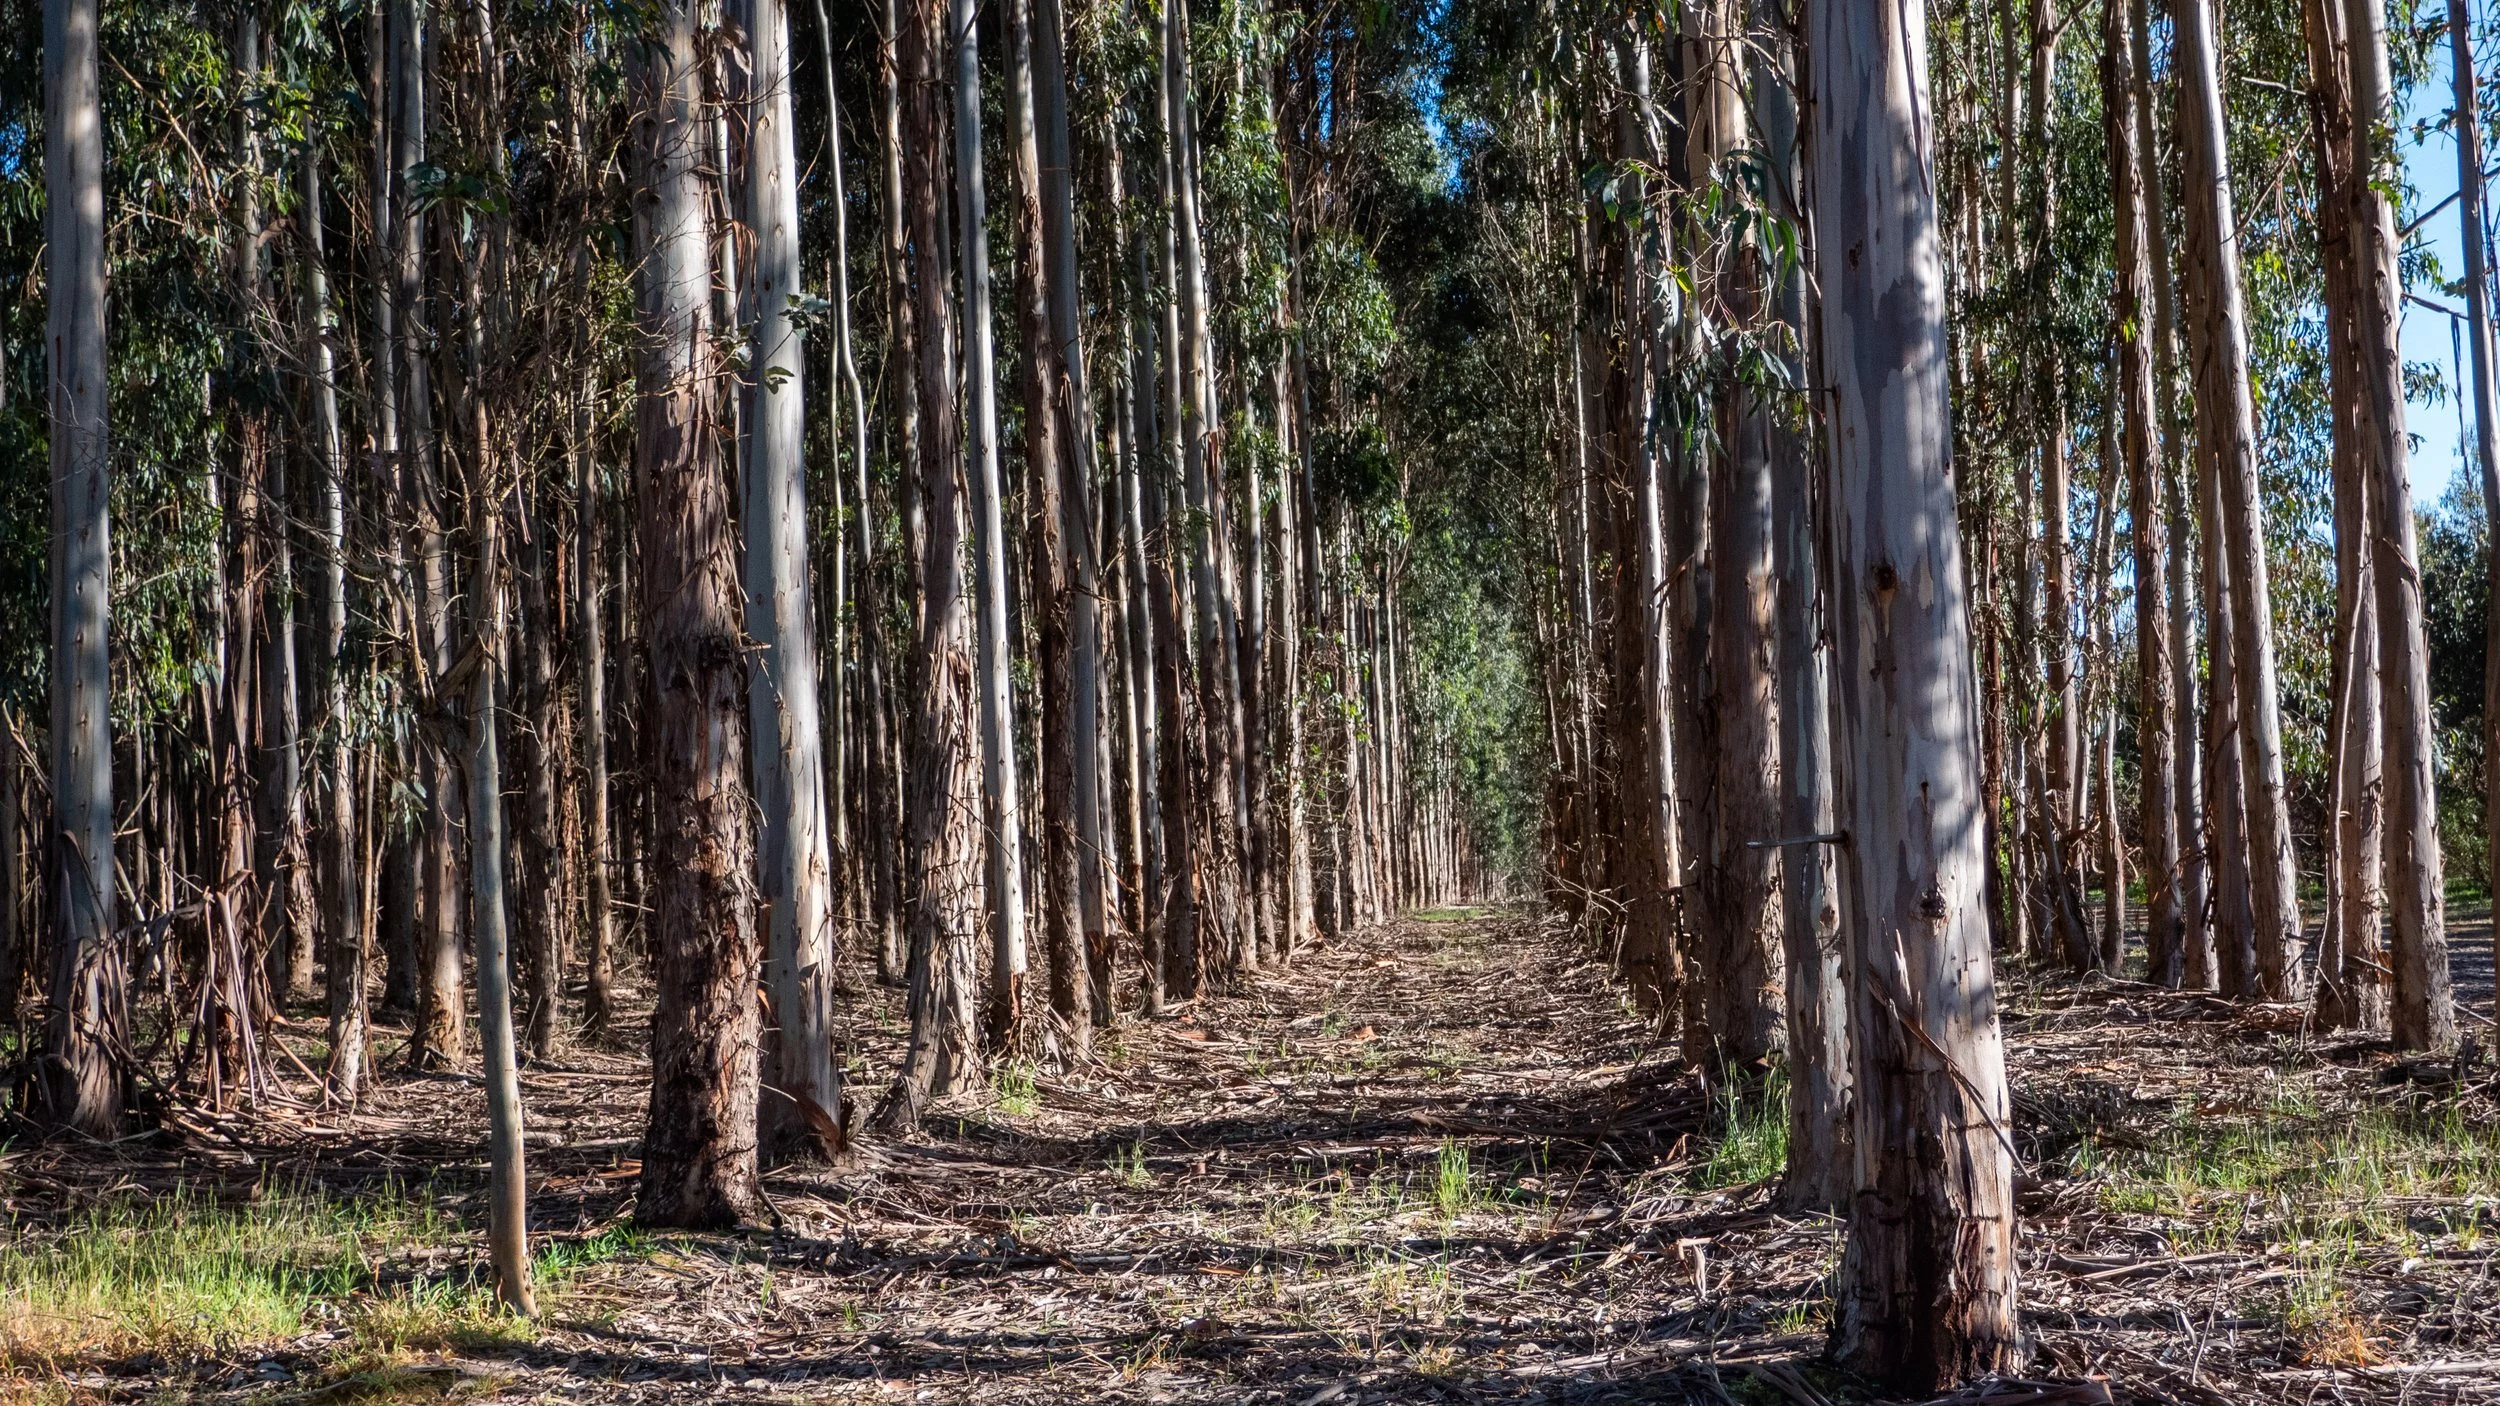
Image Credits: New Forests
What the metrics captured, and what they didn't
The pilot assessed seven metrics in total, covering ecosystem extent, site condition, and landscape-scale connectivity. Most worked. Some required significant adaptation. One didn't hold up.
The site condition metric was the most complex to implement. The NPI guidance recommends NDVI, a greenness index derived from satellite imagery, as one way to assess vegetation condition. For many contexts that is a reasonable starting point. But Debbie Saunders, who built her research career studying migratory and nectivorous species, had direct evidence that greenness and ecological quality don't always correlate. For certain species, a greener site can actually indicate less flowering and therefore lower habitat quality. The Nature Helm team pushed beyond NDVI to build condition scores that integrated structure, function, and species, combining remote sensing with ground-based observations from acoustic monitoring, camera traps, expert field surveys, and citizen science. The result was a condition metric that could reflect what was actually happening on the ground.
The natural versus semi-natural classification metric was the one that didn't work at scale. The recommended data sets effectively classified anything green as natural. For a forestry asset manager, that created two immediate problems. Plantation forests are not natural, even though they are green. And when a plantation is harvested and replanted, the models flag it as a deforestation event. A sustainable management regime looked, in the data, like land use change. New Forests had to map and code production areas separately to prevent harvesting cycles from triggering false alarms in the system.
This is not a problem unique to this pilot. The classification is not sensitive enough to capture the granularity of regrowth, replanting, and managed forest recovery at scale. NatureHelm has been working on a solution using machine learning and new multidimensional satellite imagery since the pilot concluded, and is now in final testing. The classification may also be removed from the NPI metrics going forward, though it will likely remain relevant for TNFD-aligned reporting and the IFC Performance Standards, which require disclosure of how much of a portfolio is natural versus managed.
The connectivity analysis was the metric that surprised people most. NatureHelm ran a functional connectivity analysis across each catchment, identifying where the bottlenecks in species movement were across the landscape. If a connectivity corridor outside of New Forests' land boundary is severed by a third party, no amount of work within the boundary will compensate for the loss of species movement. Seeing this mapped visually opened conversations about acquisition strategy, conservation priorities, and collaboration with neighboring landowners that the same data in a spreadsheet would not have triggered.
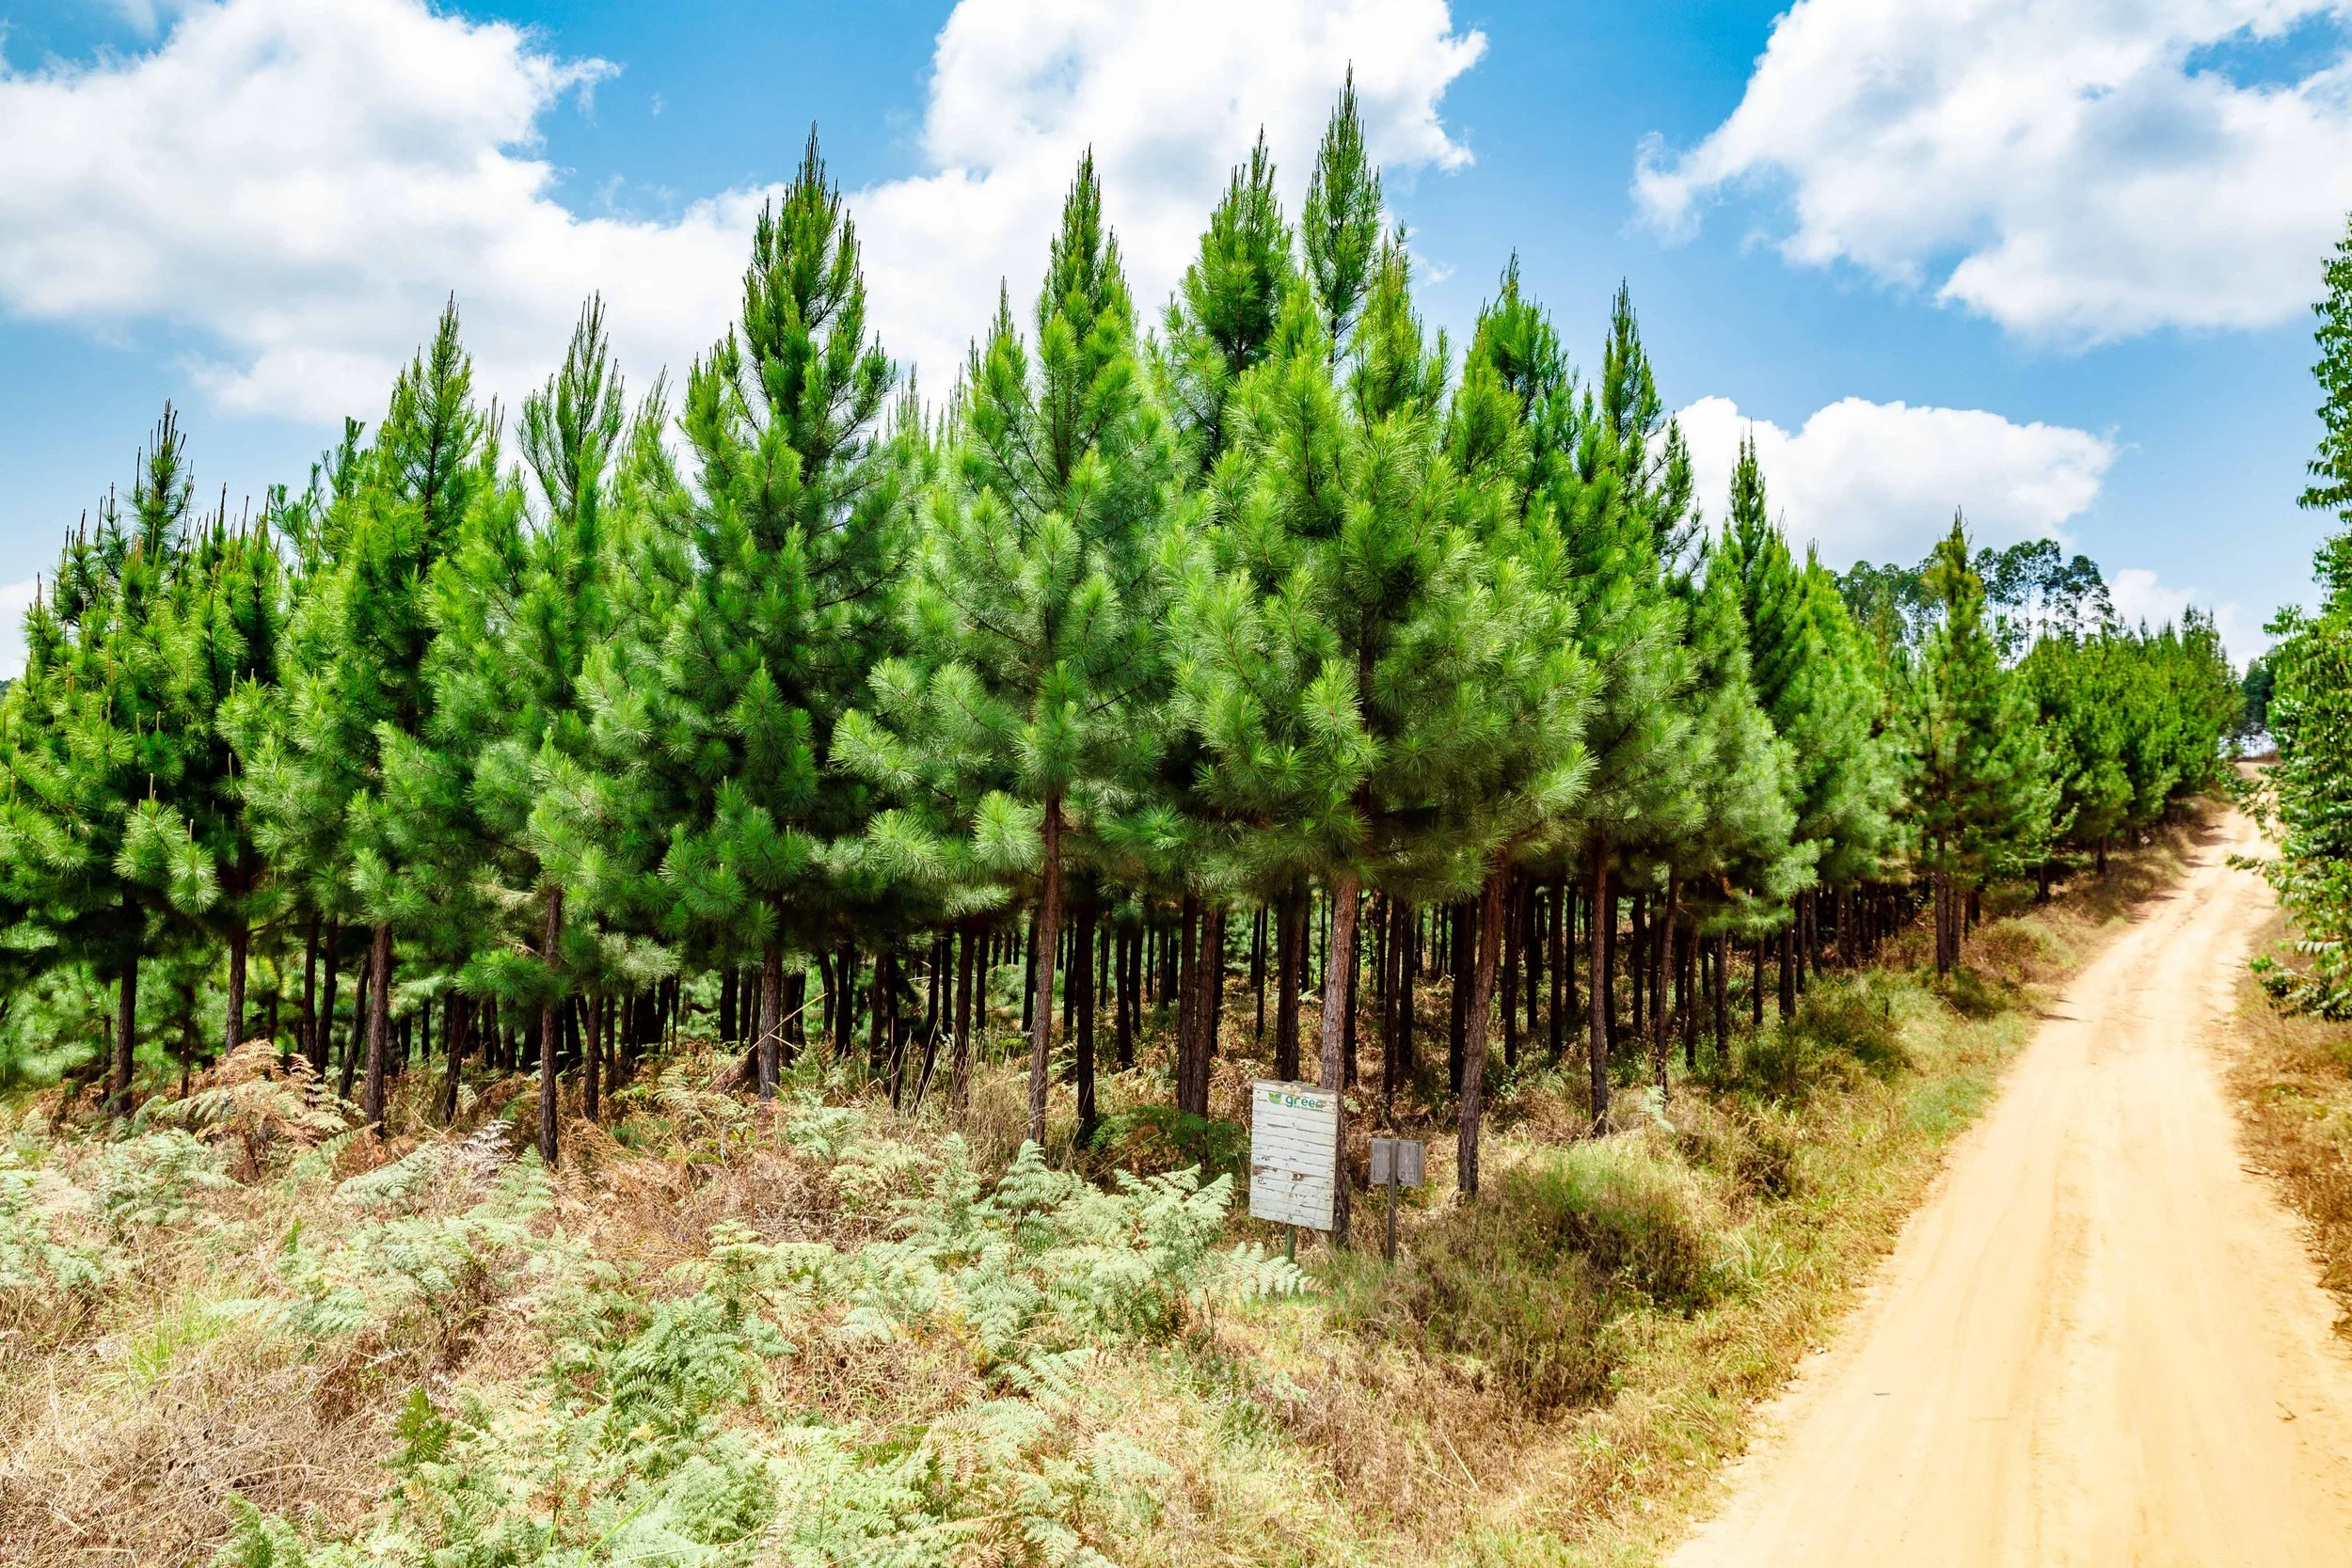
Image Credits: New Forests
What it proves
The pilot showed something neither party was certain of at the start: the NPI State of Nature metrics can be applied consistently across landscapes with very different data environments and operating contexts, enabling comparisons between assets as diverse as a plantation forest in Western Australia, a semi-natural forest in California, and a newly acquired asset in Uganda. The same framework holds all of it.
New Forests is now rolling out the calculations across its full global portfolio, including agriculture assets not covered in the pilot. The team is also exploring how consistent biodiversity data can be connected to financial outcomes, making the investment case for nature in language that capital allocators actually use.
On the regulatory side, the NPI metrics already overlap partially with TNFD. As part of the pilot, New Forests was paired with the TNFD as its NGO partner, and tested whether the NPI data could feed into a TNFD LEAP assessment. Some of it can, particularly across the locate and evaluate stages. The TNFD also recently closed a consultation, in partnership with GRI and SBTN, on formally adopting the NPI metrics as core indicators. For organisations navigating multiple competing frameworks, that convergence is worth watching.
New Forests is also looking at what consistent biodiversity data could mean for biodiversity credit markets. One barrier to developing biodiversity credit projects is the volume and cost of on-ground data required to get a project started. The question being explored is whether satellite and remote sensing data, the kind used throughout this pilot, could supplement on-ground monitoring enough to lower that barrier.
What others can take from this
Think carefully about the scale at which you measure. The NPI guidance recommends a 50-kilometre buffer around each site. In some of the Australian assets, 50 kilometres goes out to sea. Nature Helm used catchment-scale connectivity analysis instead, which connected the terrestrial, freshwater, and marine ecosystems. The choice of scale changes what the analysis can actually find.
Involve the people on the ground early. The Australia pilot worked because BirdLife Australia had been surveying the region for a decade, PF Olsen knew the invasive species dynamics intimately, and the SCNRM had relationships with indigenous landowners and agricultural producers that brought in the rich local context. Remote sensing can tell you a great deal. It cannot tell you whether the greenness it is picking up is ecologically functional. The people on the ground can.
Think about how you present results. The same data, shown as a map rather than a table, started conversations that numbers alone hadn't. When the connectivity analysis was shown visually, with corridors and bottlenecks mapped across the catchment, it opened up thinking about acquisition strategy and conservation priorities that had not come up before.
Don't wait for perfect data to start. The Africa pilot produced an investor-approved impact tracking methodology from an asset base with limited baseline data. The longer a company waits to start collecting baseline data, the less credit it gets for the positive work it is already doing. If you have existing management records that were never collected with biodiversity in mind, getting them into a metric format is the first step. Invasive species control logs, harvesting records, incidental field observations: all of it can contribute once structured correctly.
NatureHelm and New Forests joined the Nature Tech Collective's Nature Tech in Action Webinar Series in May 2026. Watch the full session above.