
Cattle Tech Sector Map 2.0 Is Live: What Mapping 400+ Entities Tell Us About Sustainable Beef Industry
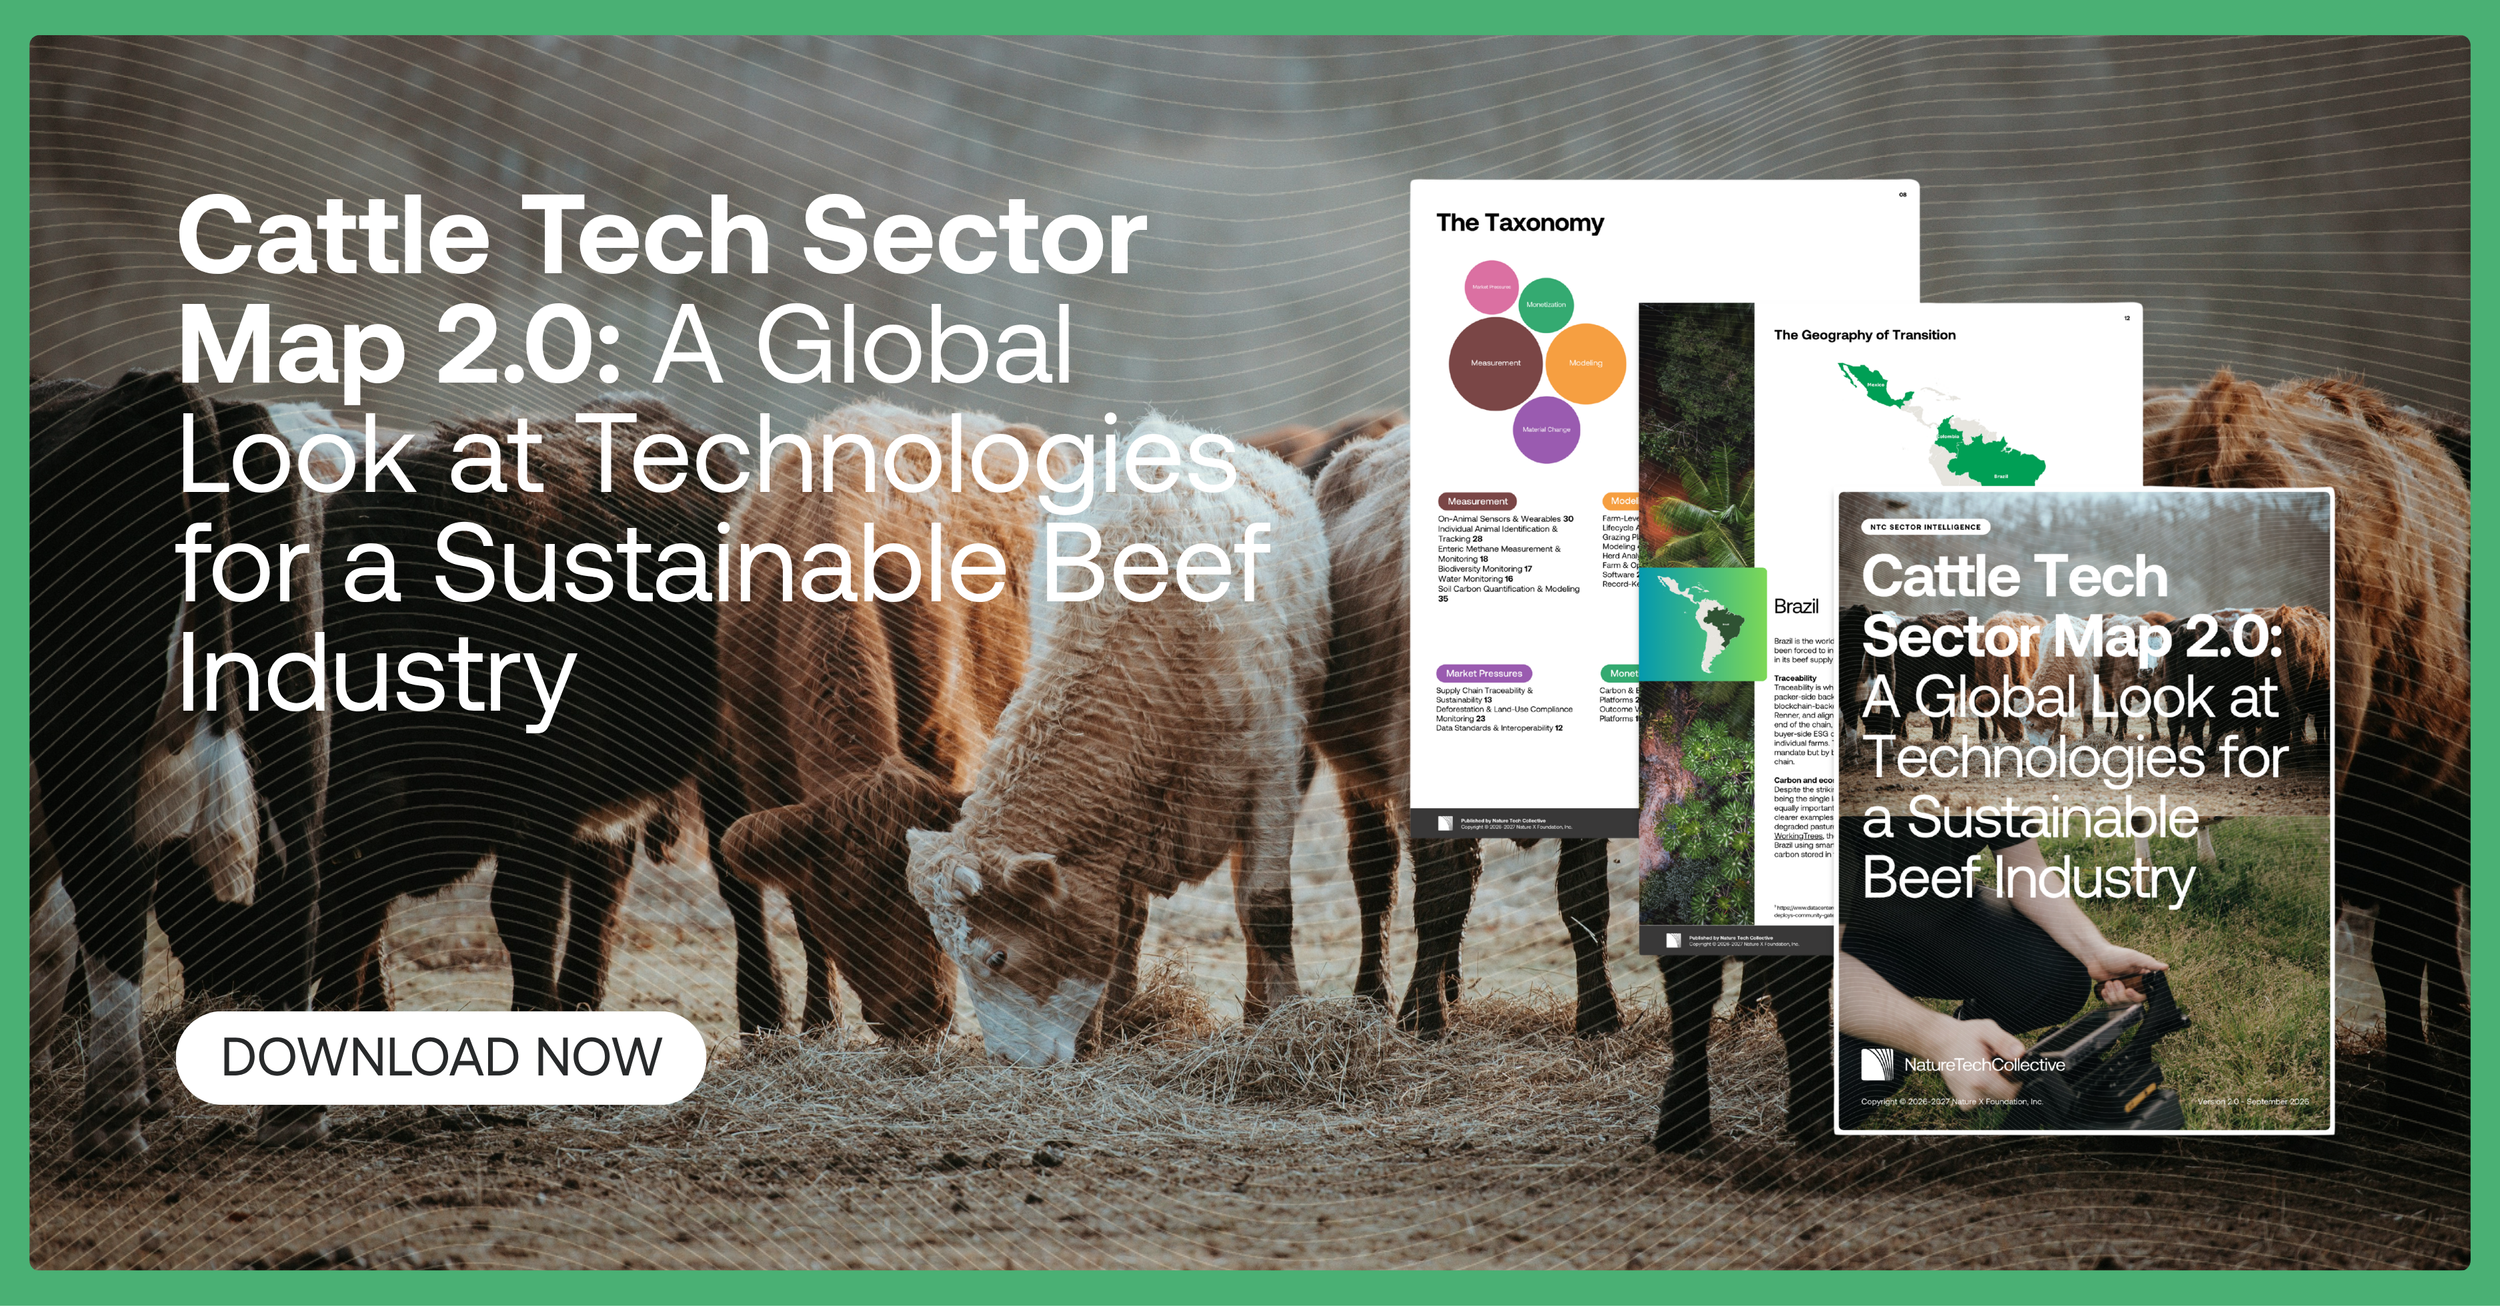
Two years have passed since the first Cattle Tech Sector Map, and the market it described has changed considerably.
In April 2025, the USDA cancelled the $3.1 billion Partnerships for Climate-Smart Commodities program, removing the largest public subsidy the US cattle tech sector had ever had. Microsoft, previously responsible for close to 90% of durable carbon removal purchases, paused new buying in early 2026. Halter raised $220 million at a $2 billion valuation, the largest venture round in New Zealand's history, even as global agrifoodtech funding sits roughly 70% below its peak. The US cattle herd fell to 86.2 million head, its smallest size since the early 1950s.
When we last interviewed experts, biodiversity and water measurement were the constraints named most often. This time, the conversation has moved toward financing, genetics, methane-reduction technology, and virtual fencing, with more attention on technologies that can create a direct economic case for producers. With regulated markets like Australia’s and the looming enforcement of the EU Deforestation Regulation, the regional variations in technologies being developed, those developing them, and the intensity of investment increasingly reflect the pressures and pulls of each region. We take a careful look at LATAM countries to understand how the region with the most extensive systems can leverage technology to reduce deforestation, increase farmer profitability, and regenerate degraded lands.
This year's Cattle Tech Sector Map maps 400+ organizations across the world's major cattle-producing markets, up from 249 in the first edition, to understand what is being built, where, and what is attracting capital.
A sector split evenly between changing practice and measuring it
The database divides into two groups of roughly equal size. About half the organizations build tools that change what producers do on the farm: feed additives, virtual fencing, wearables, breeding, and manure systems. About half build tools that measure and quantify the effects of those changes: footprinting calculators, soil-carbon modeling, traceability platforms, and credit marketplaces.
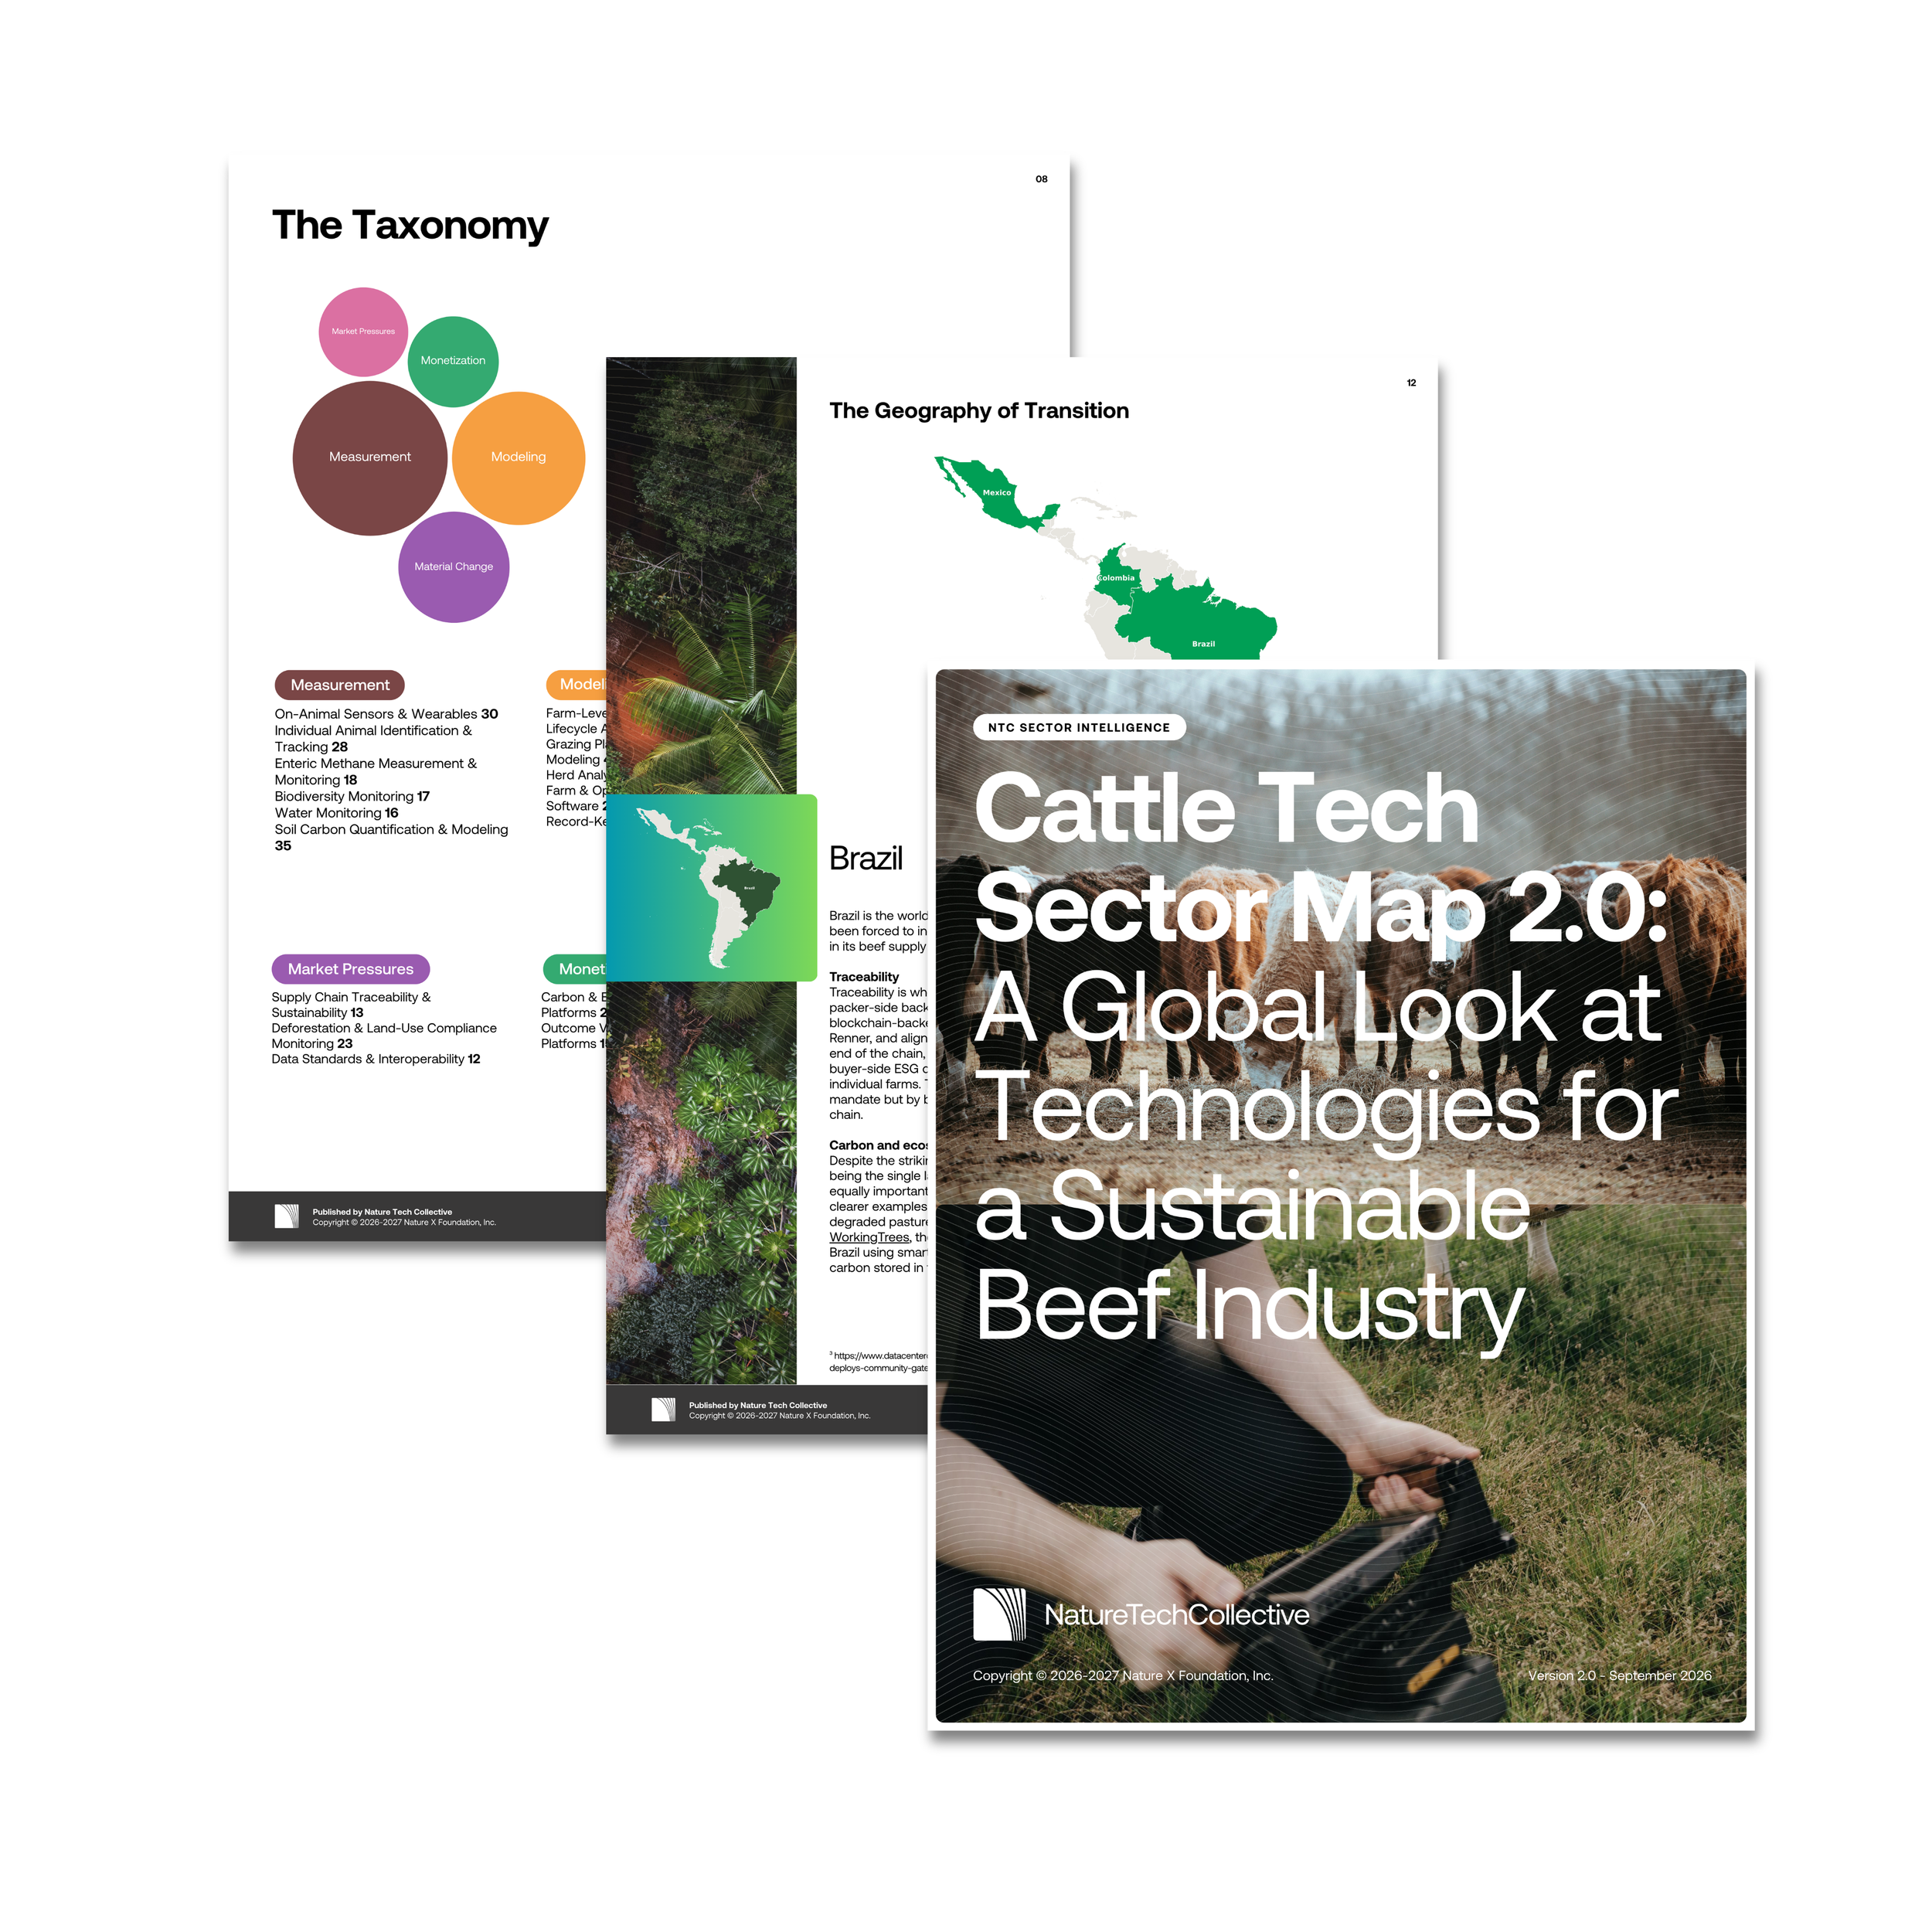
Grouped by primary category, however, the field is weighted toward quantification. Measurement (34%) and Modeling (28%) together account for 62% of all organizations mapped, well above Material Change (18%), Market Pressures (11%), and Monetization (9%). Reliable data is a precondition for carbon credits, sustainability premiums, regulatory compliance, and genetic progress, which explains the emphasis. But this is a technology map, and it excludes the non-tech-enabled project developers, impact investors, and scientific research organizations who are also major players in this transition.
Location follows pressure, not herd size
Where a given technology is developed varies considerably by region, and the pattern generally follows each region's dominant pressure rather than its herd size.
Deforestation and land-use compliance tools are concentrated in South and Central America, at about 55% of the mapped subcategory, reflecting the EU Deforestation Regulation and national traceability requirements that affect beef exports. Biodiversity monitoring is largely a European specialty, at 81%, consistent with the region's corporate nature-reporting environment. Soil-carbon quantification and manure-and-waste systems are led by Australia and North America respectively. The former represents the mature Australian Carbon Credit Unit Scheme which enables land owners to diversify income through regenerative practices while the latter reflects the intensity of feedlot operations in the region.
Capital is distributed less evenly than activity
Funding data is sparse, particularly for early-stage companies: fewer than half of the organizations scoped report funding, so the figures below are a floor, not a complete picture.
Roughly $2.6 billion in disclosed venture funding is associated with the organizations tracked. North America accounts for the largest share, about $1.34 billion. On a per-company basis, Australia and New Zealand have the stronger profile: 38% of organizations report funding, and the median round is about $12.7 million, even after setting aside the region's single largest round. South and Central America sits at the other end: the second-largest region by company count, but only around one in five organizations report funding, with a median round near $4.5 million.
The Market Pressures category includes 48 organizations but has attracted under $30 million in total, suggesting compliance and traceability tools are often built as services or shared infrastructure rather than venture-scale businesses. That could shift as European deforestation regulations move further into enforcement.
The pieces don't always connect
In the markets furthest along, the pieces of a technology stack are beginning to connect: instruments generate data, models turn that data into claims, and markets turn those claims into revenue.
In less developed markets, those layers are often still separate. Producers may adopt a single intervention, a feed additive or virtual fencing, without the measurement or market infrastructure around it. Research and policy work is still needed to develop the momentum to connect the different parts. Where the layers are better connected, the technology being developed tends to reflect the strongest local pressure, whether regulatory, commercial, or ecological.
The sector's emphasis on measurement, and whether it will be matched by investment in the more capital-intensive work of changing conditions in the rumen and on the range, is the question this data leaves open.
The full Cattle Tech Sector Map 2.0, including six-country regional deep dives and definitions for every sub-category mapped, is live now.
Explore the Cattle Tech Sector Map 2.0 here
The full dataset behind the sector map lives here.
